
Chapter 11: Was T. rex Really a Big Chicken?
Internal subpeptides like EDC of REDCA require two bonds (before E and after C) to be broken to generate the fragment ion. In contrast, prefix and suffix subpeptides require only one bond to be broken. As a result, although internal subpeptides correspond to some fragment ions, we ignore them because they are much less common than the fragment ions generated by prefix and suffix subpeptides.
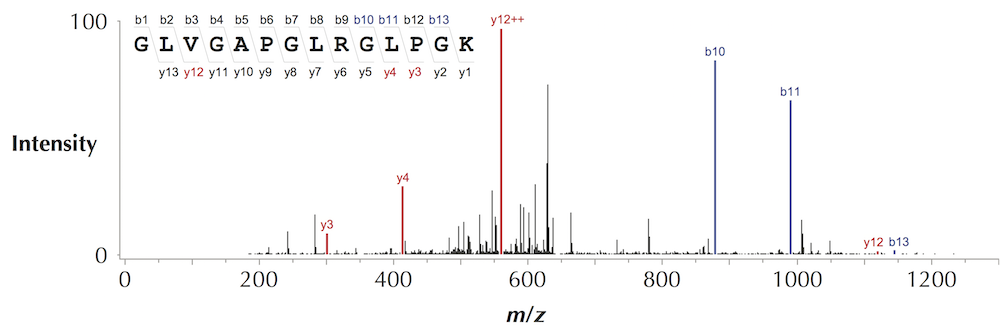
For example, how did we annotate the tall peak y12++ as having charge +2 in the figure below (one of the annotations of DinosaurSpectrum)?
As described in the main text, mass spectrometers measure the mass-to-charge ratio rather than the mass of fragment ions. Thus, a peak in a spectrum with a given mass-to-charge ratio m/z gives rise to various masses depending on its (unknown) charge z. If one of the resulting masses matches a mass in the theoretical spectrum, we may infer that the peak has charge z.
Although we rounded amino acid masses to integers to simplify the presentation, proteomics researchers do not round masses when attempting to interpret spectra. For example, amino acids K and Q have different molecular composition (C6H12ON2 versus C5H8O2N2), and they have different monoisotopic masses (128.09497 Da versus 128.05858 Da), but their integer masses are the same. Since modern mass spectrometers are very accurate, they can detect differences in masses of up to 0.01 Da in order to distinguish K and Q.
DinosaurSpectrum is reproduced below (top), along with its spectral vector (bottom).
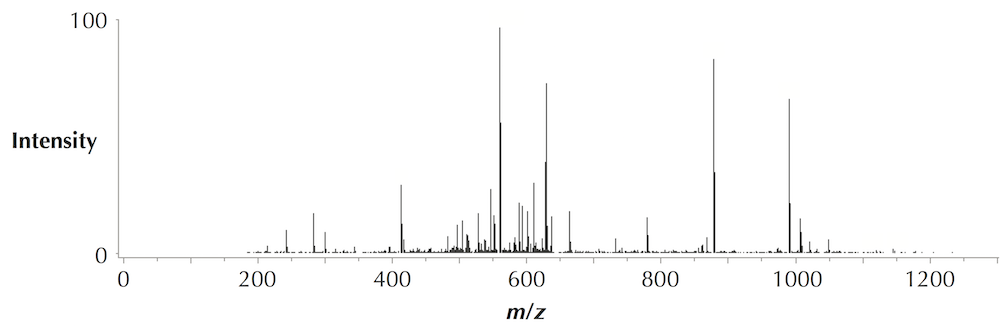
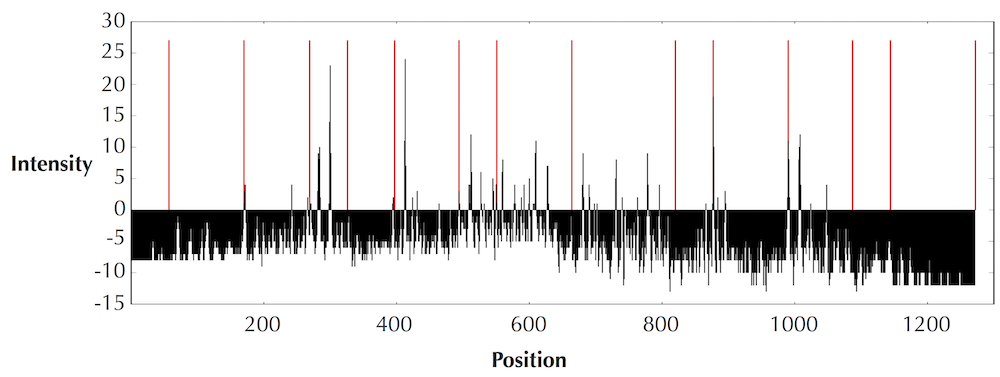
The transformation of a spectrum into a spectral vector is a complex process that takes into account many factors in addition to the heights of peaks. For details of this transformation, see Kim et al., 2008..
If a spectrum that we analyze originated from a peptide in a proteome, then it makes sense to apply peptide identification via database search and to identify this peptide. However, our knowledge of the proteomes remains incomplete even in the case of a well-studied human proteome. Biologists therefore sometimes use de novo peptide sequencing to discover peptides that do not appear in the currently known (still incomplete) proteome.
In practice, proteomics researchers do typically generate decoy databases by taking into account amino acid frequencies in the proteome under study. This is often achieved by randomly shuffling the amino acids in real proteins to generate a decoy database.
The algorithm for computing |Dictionarythreshold(Spectrum)| amounts to filling up the N*M table Size(i, t), where N is the maximum score among all peptides against Spectrum and M is the parent mass of Spectrum. To fill in each element of this table, we need to consider all possible amino acids and apply the equation for Size(i, t) from the section "Spectral Dictionaries".
ISBN: 978-0-9903746-3-3