
Chapter 6: Are There Fragile Regions in the Human Genome?
(Coursera Week 4)
Indeed, mouse and human have a common ancestor from which they have both evolved. Yet when we construct a scenario consisting of n rearrangements transforming the mouse genome into the human genome, the first x rearrangements represent a transformation of the mouse genome into the ancestor genome (going back in time) and the last n-x rearrangements represent a transformation from the ancestor to the human genome. This relies on the fact that the rearrangements we consider are invertible, e.g., the inverse operation of a reversal is a reversal.
In a Poisson distribution, we assume that some event is happening on average λ times within a given interval of fixed length, with no relationship between the occurrences. That is, if we look at a given interval, we will see on average λ occurrences, but there may be any finite number of occurrences in practice. If the Random Breakage Model is true, then the Poisson distribution offers a good model for the number of breakpoints that occur in a given interval of the genome.
Letting Nt denote the number of events occurring between point 0 and point t, it can be shown that the probability of exactly k events in an interval of unit length is given by the formula
where k is allowed to be any nonnegative integer and e = 2.7182818284... is the base of the natural logarithm.
In particular, the probability of no events (N1 = 0) is given by e-λ. Note that if we scale the interval's unit of measurement to any positive real number x (measured in units of the original interval), we obtain that Pr(Nx = 0) is instead e-λx.
Now, we are interested in not the number of events (i.e., breakpoints) occurring in a given interval of time, but rather, the distribution of the distances between events (i.e., distances between breakpoints along the genome). Accordingly, let Xt denote the random variable corresponding to the time needed for the next event, given that the last event occurred at time t. We will first write
Note that Pr(Xt > x) is equal to Pr(Nt = Nt+x), and so
The Poisson distribution is "memoryless", meaning that the interval between t and t+x is equivalent to the interval between 0 and x in terms of probability, so that we can conclude that
The probability on the right is what we calculated above, and so we conclude that Pr(Xt ≤ x) = 1-e-λx. This is the cumulative distribution function of an exponential random variable, which is what we set out to demonstrate.
Notation adapted from http://stats.stackexchange.com/questions/2092/relationship-between-poisson-and-exponential-distribution
A permutation is a specific ordering of the positive integers from 1 to n, where each element is used exactly once. For example, there are six permutations of length 3:
In this book, we often use the term "permutation" as shorthand for a signed permutation, in which each element has a sign, or orientation (represented as a "+" or "-"). You can verify that there are 48 signed permutations of length 3.
You can label repeated elements in the first genome using subscripts so that each synteny block appears just once, e.g., (+a +b1 +c +b2). You can then label the second genome either as (+a -b1 +b2 -c) or as (+a -b2 +b1 -c) and compute the 2-break distance from (+a +b1 +c +b2) to each of the two resulting genomes, selecting the one that results in the minimum 2-break distance as the best labeling.
The problem with this approach is that the number of re-labelings of a permutation with duplicated elements may grow very quickly. Furthermore, this approach only works when the number of copies of the same synteny block in each of genome is the same.
The easiest way to deal with synteny blocks that appear in one genome and not another is to ignore them and consider only those blocks common to both genomes, e.g., in this case to compare (+a +b +c) with (+c -b +a). It is also possible to incorporate insertions and deletions into genome rearrangement studies, providing some penalty for the insertion/deletion of a single block, or a penalty for the insertion/deletion of a series of contiguous blocks. Various research papers have attempted to expand genome rearrangement metrics to account for insertions and deletions.
Given a permutation P and a reversal ρ, we denote the genome resulting from applying ρ to P as P*ρ. A reversal ρ is called P-valid if the reversal distance of P*ρ is smaller than the 2-break distance of P. The following recurrence relation computes NumberOfScenarios(P), the number of different reversal scenarios that transform a genome P into the identity permutation using the minimum number of reversals:
The pair (+4 +3) forms a breakpoint because, in contrast to (-4 -3), it cannot be transformed into (+3 +4), a desirable pair when sorting by reversals, by a single reversal. For example, applying a reversal to
transforms this permutation into
but applying a reversal to
transforms it into the identity permutation
To better understand why (+4 +3) is a breakpoint, try sorting the permutation (+6 +5 +4 +3 +2 +1) – you will see that it requires many reversals!
Yes! For example, a transposition moves a segment from one location in the genome to another. For example, one transposition applied to the blue region of the chromosome (+1 +2 +3 +4 +5 +6 +7) yields (+1 +5 +6 +2 +3 +4 +7). However, transpositions are more rare than reversals and other rearrangements discussed in the chapter.
Transpositions represent an example of a 3-break, a rearrangement that requires 3 rather than 2 breaks (between +1 and +2, between +4 +5, and between +6 and +7). Since 3-breaks are rare compared to 2-breaks, we can obtain reasonable distance functions without them, and so 3-breaks are not covered in this chapter.
(Coursera Week 5)
The section “Breakpoint Graphs” shows a trivial breakpoint graph BreakpointGraph(P, P) for P = (+a –b –c +d). Another trivial breakpoint graph is seemingly formed by the genomes P and Q = (-a +b +c -d). But note that P and Q represent the same circular chromosome traversed in opposite directions; therefore, P and Q are indeed identical.
The following explanation is a modification of one given by one of our excellent community TAs, Giampaolo Eusebi.
Keep in mind that:
- Every even number 2x is a black node head, and every even number 2x−1 is a black node tail;
- every colored edge is composed by two numbers representing black heads or tails.
That being said, the order should not be very important. Take, for example, the following edge list:
If you start with (2,4):
- (2,4) ends with a 4 (even), and the only edge that starts with 4−1=3 is (3,6);
- (3,6) ends with a 6 (even), and the only edge that starts with 6−1=5 is (5,1);
- (5,1) ends with a 1 (odd), and the only edge that starts with 1+1=2 is (2,4), which brings us back where we started, thus forming a cycle.
The only remaining edges are (7,9), (10,12),(11,8). If you start with (7,9):
- (7,9) ends with a 9 (odd), and the only edge that starts with 9+1=10 is (10,12);
- (10,12) ends with a 12 (even), and the only edge that starts with 12−1=11 is (11,8);
- (11,8) ends with a 8 (even), and the only edge that starts with 8−1=7 is (7,9), which brings us back where we started, thus forming a cycle.
The edge list is now empty. The key point is that we will have obtained the same two cycles regardless of which edges we chose as starting points (feel free to try it for yourself).
We used 2-break distance for circular chromosomes to refute the Random Breakage Model. See “DETOUR: Sorting linear permutations by reversals” or Bergeron, Mixtacki, Stoye 2006 (https://pub.uni-bielefeld.de/publication/1596811) to see that similar formulas hold for linear chromosomes.
In addition to the dots representing conserved genes between two species, genomic dot-plots contain many spurious dots. As discussed in the main text, even randomly generated strings have shared k-mers that result in "spurious" dots in their genomic dot-plots. Moreover, these spurious k-mers may aggregate into spurious diagonals that must be removed for follow-up analysis of synteny blocks. Since these spurious diagonals are usually short, we filter out short diagonals when constructing synteny blocks.
Our algorithm for constructing synteny blocks, which is based on shared k-mers, does account for mutations. For example, even though the two "genes" ACTGAGTTC and ACTGGGTTC differ from each other by a mutation (A -> G), the genomic dot-plot with k = 3 will reveal that they form a single synteny block; construct this dot-plot and see for yourself!
Modern programs for constructing synteny blocks use dot-pots representing all local alignments (with scores exceeding a threshold) rather than all shared k-mers between the two genomes. However, constructing all such local alignments for long genomes is a time-consuming task.
As specified in the main text:
We color the point (x, y) red if the two genomes share a k-mer at respective positions x and y. We color (x, y) blue if the k-mer starting at position x in the first genome is the reverse complement of the k-mer starting at position y in the second genome.
This definition does not specify what to do with reverse palindromes. A reverse palindrome is a DNA string that is its own reverse complement, such as ACGCGT. If a reverse complement starts at respective positions x and y in two genomes, then (x, y) should technically be colored both red and blue! To address this issue, we will use only red to color points corresponding to reverse palindromes.
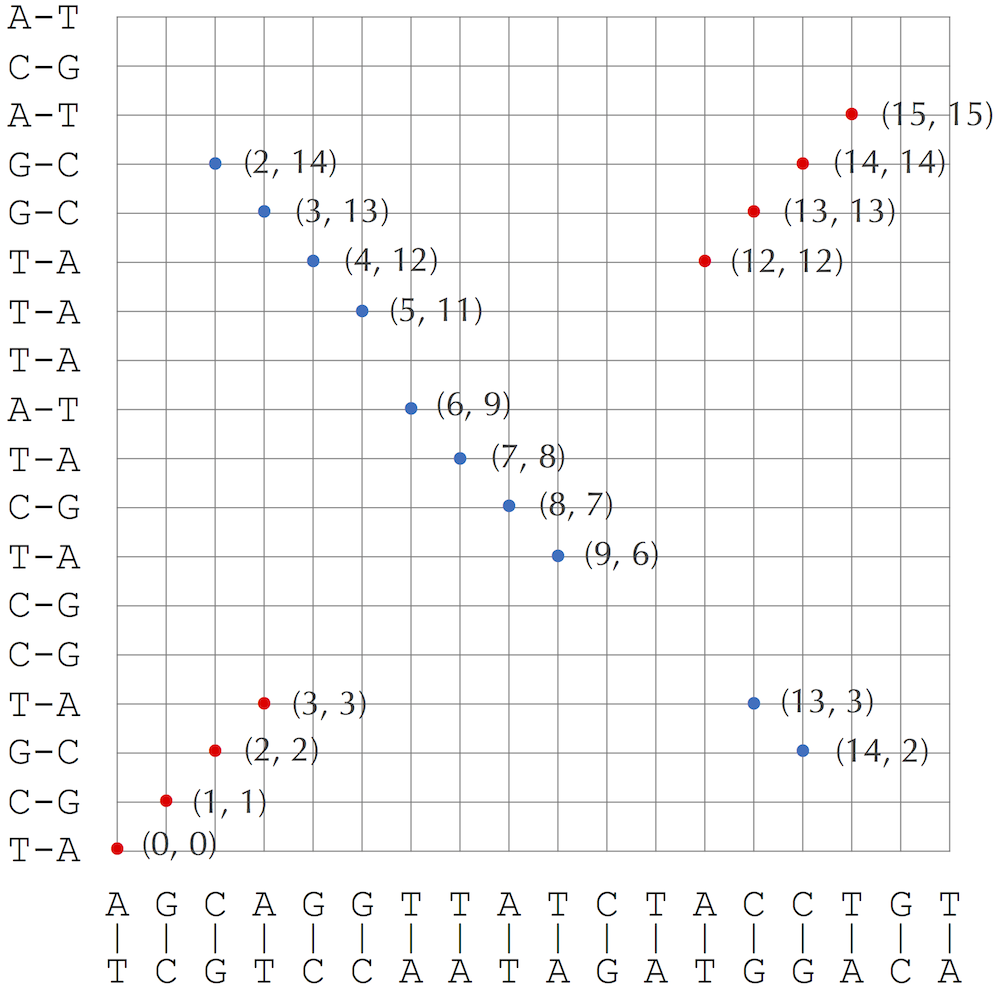
Yes. For example, the strings AGCAGGTTATCTACCTGT and AGCAGGAGATAAACCTGT can be transformed into sequences of their 3-mers along with these 3-mers' respective starting positions:
(AGC,0) (GCA,1) (CAG,2) (AGG,3) (GGT,4) (GTT,5) (TTA,6) (TAT,7) (ATC,8) (TCT,9) (CTA,10) (TAC,11), (ACC,12) (CCT,13) (CTG,14) (TGT,15)
(AGC,0) (GCA,1) (CAG,2) (AGG,3) (GGA,4) (GAG,5) (AGA,6) (GAT,7) (ATA,8) (TAA,9) (AAA,10) (AAC,11) (ACC,12) (CCT,13) (CTG,14) (TGT,15)
We now take the reverse complement of each 3-mer of the second string AGCAGGACATAAACCTGT and color them blue:
(GCT,0) (TGC,1) (CTG,2) (CCT,3) (TCC,4) (CTC,5) (TCT,6) (ATC,7) (TAT,8) (TTA,9) (TTT,10) (GTT,11) (GGT,12) (AGG,13) (CAG,14) (ACA,15)
Afterwards, we lexicographically merge and sort all three arrays into a single array:
(AAA,10) (AAC,11) (ACA,15) (ACC,12) (ACC,12) (AGA,6) (AGC,0) (AGC,0) (AGG,3) (AGG,3) (AGG,13) (GTT,11) (ATA,8) (ATC,8) (ATC,7) (CAG,2) (CAG,2) (CAG,14) (CCT,13) (CCT,13) (CCT,3) (CTA,10) (CTC,5) (CTG,14) (CTG,2) (CTG,14) (GAG,5) (GAT,7) (GCA,1) (GCA,1) (GCT,0) (GGA,4) (GGT,4) (GGT,12) (TAA,9) (TAC,11) (TAT,7) (TAT,8) (TCC,4) (TCT,9) (TCT,6) (TGC,1) (TGT,15) (TGT,15) (TTA,6) (TTA,9) (TTT,10)
We will retain only 3-mers that appear as a black 3-mer and a colored 3-mer:
(ACC,12) (ACC,12) (AGC,0) (AGC,0) (AGG,3) (AGG,3) (AGG,13) (ATC,8) (ATC,7) (CAG,2) (CAG,2) (CAG,14) (CCT,13) (CCT,13) (CCT,3) (CTG,14) (CTG,2) (CTG,14) (GCA,1) (GCA,1) (GGT,4) (GGT,12) (GTT,5) (GTT,11) (TAT,7) (TAT,8) (TCT,9) (TCT,6) (TGT,15) (TGT,15) (TTA,6) (TTA,9)
If a 3-mer appears in this list as black and red with positions x and y, then we add a red point (x, y) to the genomic dot-plot (note: in this case x = y). If a 3-mer appears in this list as black and blue with respective positions x and y, then we add a blue point (x, y) to the genomic dot-plot. See the figure below.
(ACC,12) (ACC,12) (12,12)
(AGC,0) (AGC,0) (0,0)
(AGG,3) (AGG,3) (AGG,13) (3,3), (3,13)
(ATC,8) (ATC,7) (8,7)
(CAG,2) (CAG,2) (CAG,14) (2,2), (2,14)
(CCT,13) (CCT,13) (CCT,3) (13,13), (13,3)
(CTG,14) (CTG,2) (CTG,14) (14,2), (14,14)
(GCA,1) (GCA,1) (1,1)
(GGT,4) (GGT,12) (4,12)
(GTT,5) (GTT,11) (5,11)
(TAT,7) (TAT,8) (7,8)
(TCT,9) (TCT,6) (9,6)
(TGT,15) (TGT,15) (15,15)
(TTA,6) (TTA,9) (6,9)
2-breaks include reversals, but not every 2-break is a reversal. For example, one 2-break on the linear chromosome (+a +b +c +d +e) may yield a fission operation, resulting in the linear chromosome (+a +b +e) and the circular chromosome (+c +d).
ISBN: 978-0-9903746-3-3