
Lesson 1.7
Peculiar Statistics of the Forward and Reverse Half-Strands
Watch the lectureFrom a Biological Insight Toward an Algorithm for Finding the Replication Origin (Part 2)
The figure below reveals a surprising pattern. We have partitioned the E. coli genome into 46 equally sized fragments of approximately 100,000 nucleotides, starting at the experimentally verified terminus of replication, and then computed the frequency of cytosine in each window. The first 23 fragments (starting from ter) represent the reverse half-strand, and the last 23 fragments (starting at ori) represent the forward half-strand. Most fragments on the reverse half-strand have a high cytosine frequency (above 25%), whereas most fragments on the forward half-strand have a low cytosine frequency (below 25%).
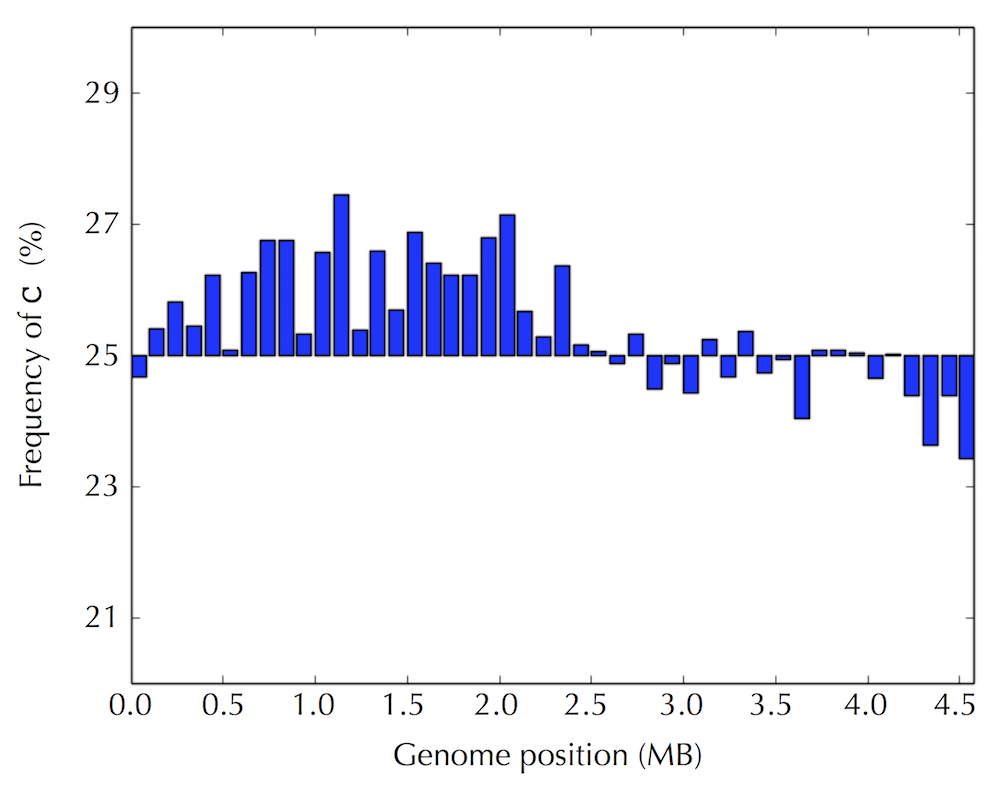
Figure: The frequency of cytosine in each of 46 equal-length disjoint fragments (of approximately 100,000 nucleotides each) covering the E. coli genome. The ter site is located at position 0, whereas the ori site is located roughly opposite to ter on the circular E. coli chromosome approximately 2.3 million nucleotides away from ter. The reverse half-strand spans the first half of the histogram (from 0 to ori), whereas the forward half-strand spans the second half of the histogram (starting from ori).
In contrast, as the figure below illustrates, most fragments on the reverse half-strand have a low guanine frequency (below 25%), whereas most fragments on the forward half-strand have a high guanine frequency (above 25%).
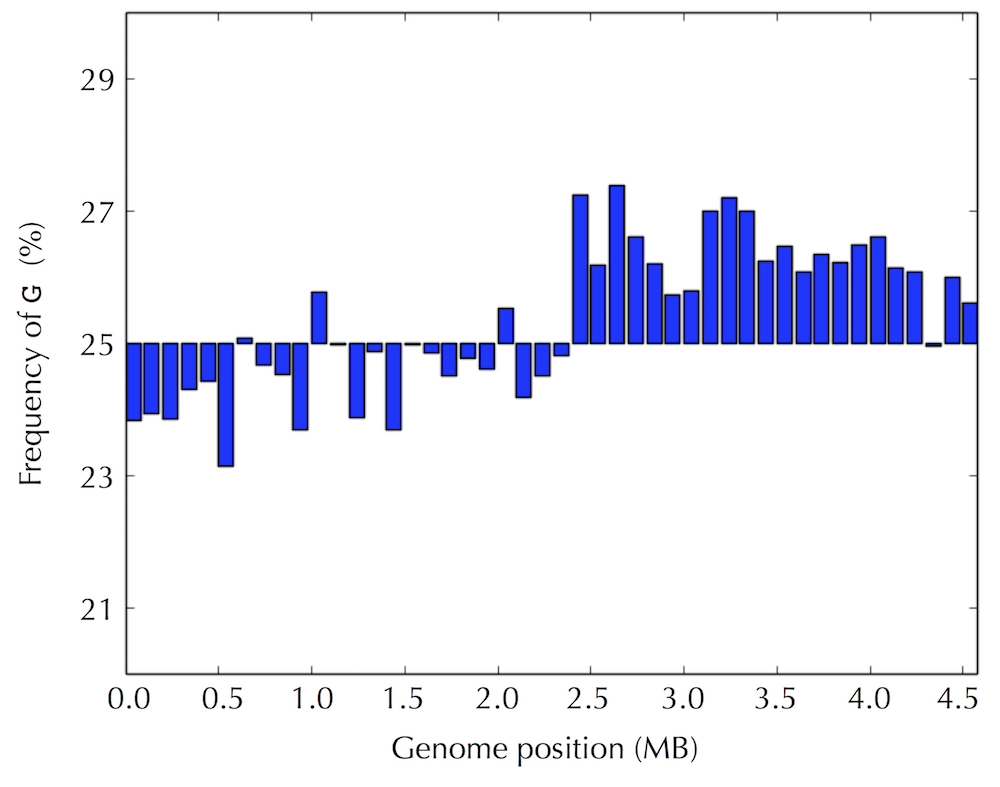
Figure: The frequency of guanine in the same 46 fragments in the E. coli genome compared to the previous step.
The figure below shows the difference in frequencies of G and C in each genome fragment and presents an even more striking visualization of the peculiar statistics of nucleotide frequencies on the reverse and forward half-strands.
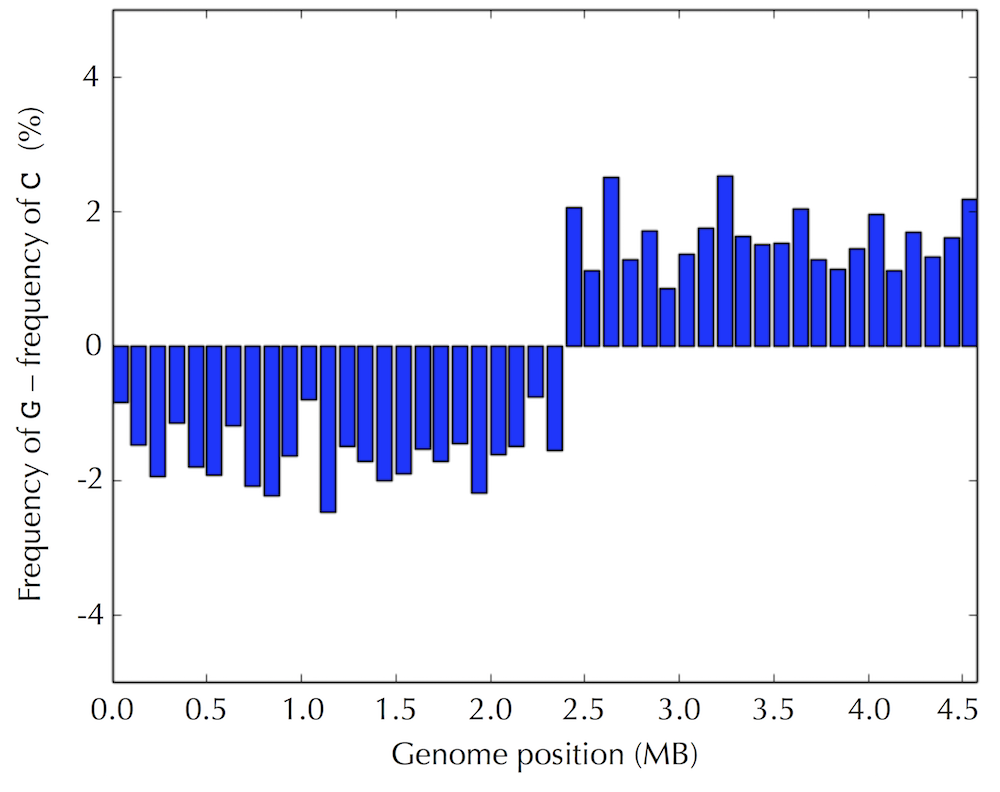
Figure: The difference between the frequencies of guanine and cytosine across the 46 fragments of the E. coli genome, assuming that the genome begins at the experimentally verified ter of E. coli.
Even if we assume that we do not know the location of ori in advance, the pattern still presents itself when starting at an arbitrary position of the E. coli genome, as shown in the figure below.
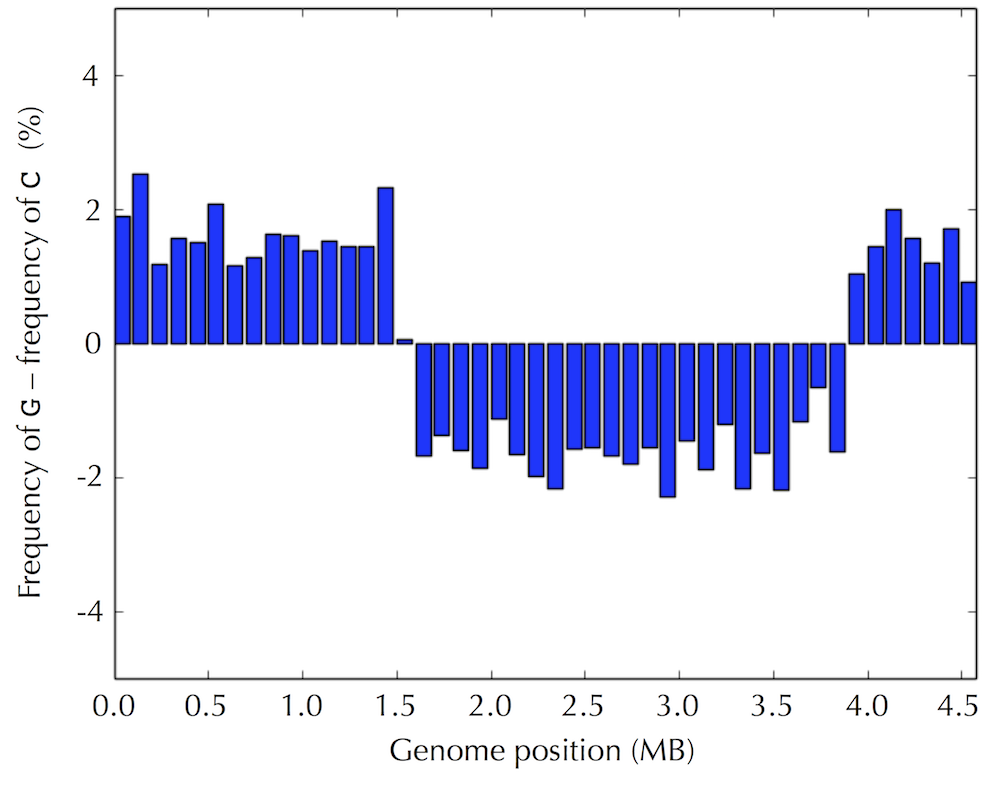
Figure: The difference between the frequencies of guanine and cytosine across the 46 fragments of the E. coli genome, assuming that the genome begins at an arbitrary selected location.
If the pattern that we have found isn't a statistical fluke, then we have uncovered a hint about how to find ori --- we can simply walk along the genome and check where the difference between the frequency of guanine and cytosine switches from negative to positive! But why in the world would such a simple test allow us to find the replication origin of a bacterium?
In the last section, we saw that as the replication fork expands, DNA polymerase synthesizes DNA quickly on the reverse half-strand but suffers delays on the forward half-strand. We will explore the asymmetry of DNA replication to design a new algorithm for finding ori.
How in the world can the asymmetry of replication possibly help us locate ori? Notice that since the replication of a reverse half-strand proceeds quickly, it lives double-stranded for most of its life. Conversely, a forward half-strand spends a much larger amount of its life single-stranded, waiting to be used as a template for replication. This discrepancy between the forward and reverse half-strands is important because single-stranded DNA has a much higher mutation rate than double-stranded DNA. In particular, if one of the four nucleotides in single-stranded DNA has a greater tendency than other nucleotides to mutate in single-stranded DNA, then we should observe a shortage of this nucleotide on the forward half-strand.
Following up on this thought, let’s compare the nucleotide counts of the reverse and forward half-strands. If these counts differ substantially, then we will design an algorithm that attempts to track down these differences in genomes for which ori is unknown. The nucleotide counts for the forward and reverse half-strands of the Thermotoga petrophila genome are shown in the table below.

STOP and Think Do you notice anything about the nucleotide counts in this table?
Although the frequencies of A and T are practically identical on the two half-strands, C is more frequent on the reverse half-strand than on the forward half-strand, resulting in a difference of 219518 - 207901 = +11617. Its complementary nucleotide G is less frequent on the reverse half-strand than on the forward half-strand, resulting in a difference of 201634 - 211607 = -9973.
It turns out that we observe these discrepancies because cytosine (C) has a tendency to mutate into thymine (T) through a process called deamination. Deamination rates rise 100-fold when DNA is single-stranded, which leads to a decrease in cytosine on the forward half-strand. Also, since C-G base pairs eventually change into T-A base pairs, deamination results in the observed decrease in guanine (G) on the reverse half-strand (recall that a forward parent half-strand synthesizes a reverse daughter half-strand, and vice-versa).
STOP and Think If deamination changes cytosine to thymine, why do you think that the forward half-strand still has some cytosine?
The skew diagram
Let's see if we can take advantage of these peculiar statistics caused by deamination to locate ori. As the table on the previous step illustrates, the difference between the total amount of guanine and the total amount of cytosine is negative on the reverse half-strand (201634 - 219518 = -17884) and positive on the forward half-strand (211607 - 207901 = 3706). Thus, our idea is to traverse the genome, keeping a running total of the difference between the counts of G and C. If this difference starts increasing, then we guess that we are on the forward half-strand; on the other hand, if this difference starts decreasing, then the we guess that we are on the reverse half-strand. See the figure below.
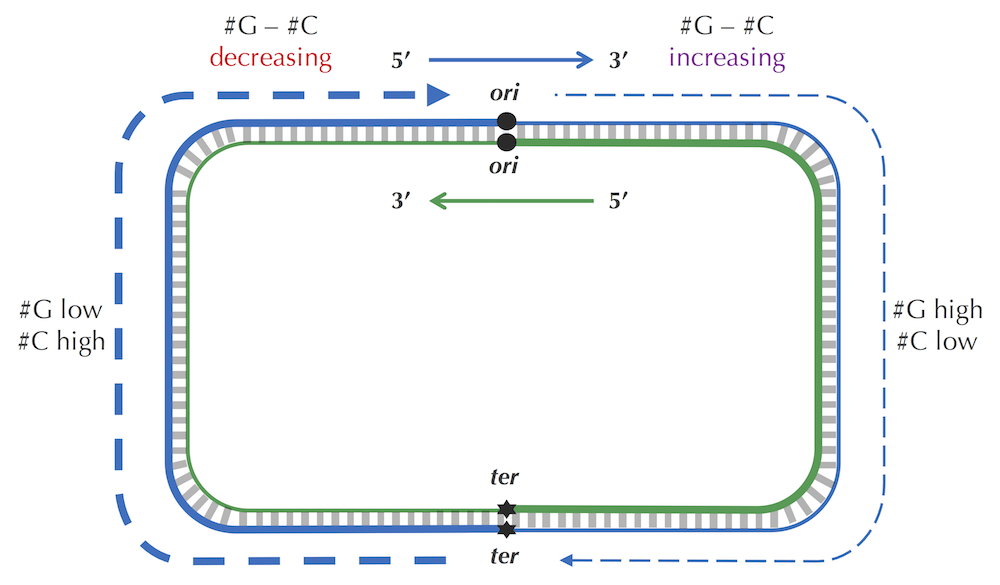
STOP and Think Imagine that you are reading through the genome (in the 5’ → 3' direction) and notice that the difference between the guanine and cytosine counts just switched its behavior from decreasing to increasing. Where in the genome are you?
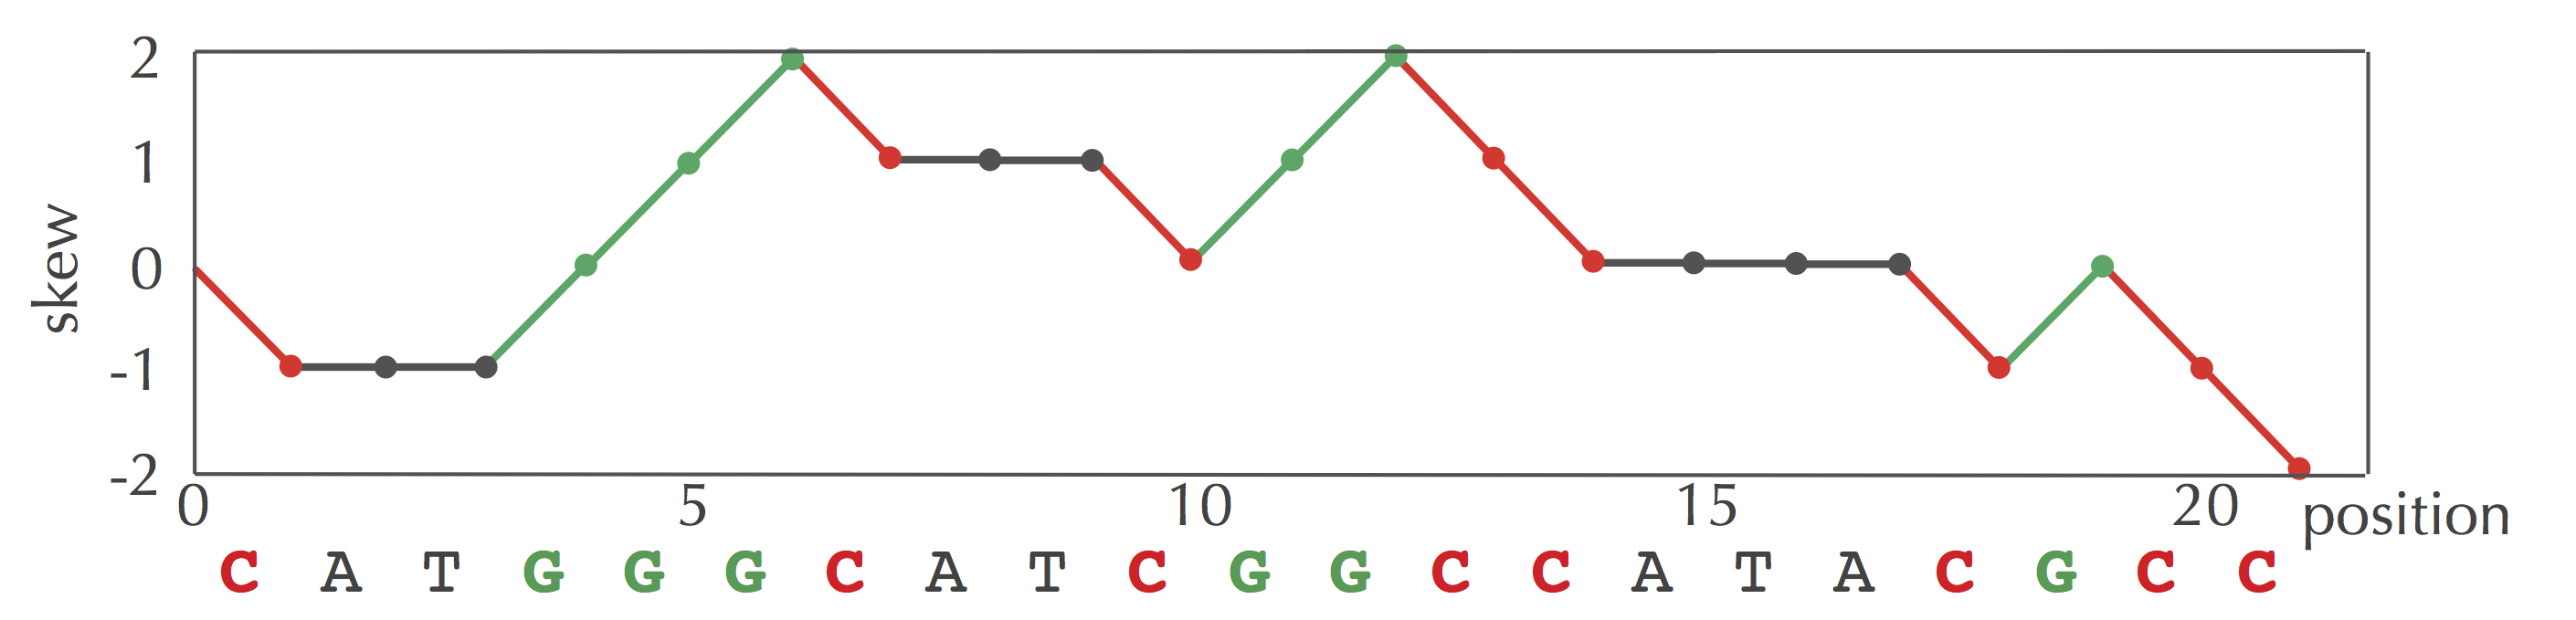
Since we don't know the location of ori in a circular genome, let's linearize it (i.e., select an arbitrary position and pretend that the genome begins here), resulting in a linear string Genome. We define Skewi(Genome) as the difference between the total number of occurrences of G and the total number of occurrences of C in the first i nucleotides of Genome. The skew diagram is defined by plotting Skewi (Genome) (as i ranges from 0 to |Genome|), where Skew0 (Genome) is set equal to zero. The figure below shows a skew diagram for the DNA string CATGGGCATCGGCCATACGCC.
Note that we can compute Skewi+1(Genome) from Skewi(Genome) according to the nucleotide in position i of Genome. If this nucleotide is G, then Skewi+1(Genome) = Skewi(Genome) + 1; if this nucleotide is C, then Skewi+1(Genome)= Skewi(Genome) – 1; otherwise, Skewi+1(Genome) = Skewi(Genome).
Exercise Break Find all values of Skewi (GAGCCACCGCGATA) for i ranging from 0 to 14.
Now we show the skew diagram for a linearized E. coli genome. Notice the very clear pattern! It turns out that the skew diagram for many bacterial genomes has a similar characteristic shape.
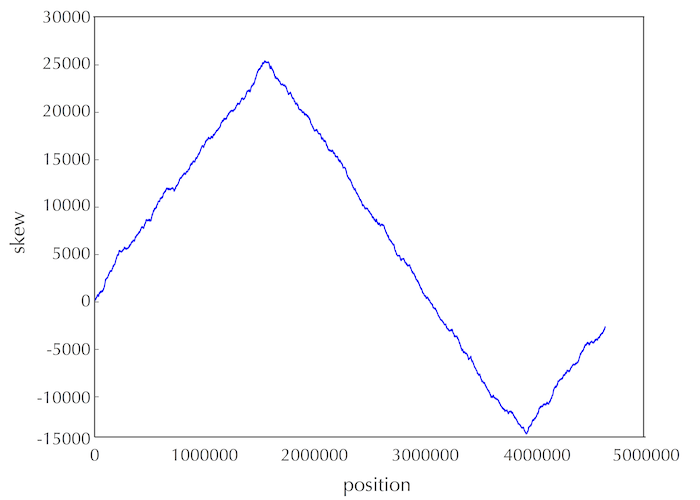
STOP and Think After looking at this skew diagram, where do you think that ori is located in E. coli?
Let's follow the 5' → 3' direction of DNA and walk along the chromosome from ter to ori (along a reverse half-strand), then continue on from ori to ter (along a forward half-strand). In our previous discussion, we saw that the skew is decreasing along the reverse half-strand and increasing along the forward half-strand. Thus, the skew should achieve a minimum at the position where the reverse half-strand ends and the forward half-strand begins, which is exactly the location of ori!
We have just developed an insight for a new algorithm for locating ori: it should be found where the skew attains a minimum.
Minimum Skew Problem: Find a position in a genome where the skew diagram attains a minimum.
- Input: A DNA string Genome.
- Output: All integer(s) i minimizing Skewi (Genome) among all values of i (from 0 to |Genome|).
Code Challenge Solve the Minimum Skew Problem. (Solve on Cogniterra or Rosalind.)Solve it with the autograderFree to start in the interactive text
STOP and Think Note that the E. coli skew diagram below changes depending on where we start our walk along the circular chromosome. Do you think that the minimum of the skew diagram points to the same position in the genome regardless of where we begin walking to generate the skew diagram?