
Chapter 3 Epilogue
Genome Assembly Faces Real Sequencing Data
Watch the lectureDe Bruijn Graphs Face Harsh Realities of Assembly
Our discussion of genome assembly has thus far relied upon various assumptions. Accordingly, applying de Bruijn graphs to real sequencing data is not a straightforward procedure. Below, we describe practical challenges introduced by quirks in modern sequencing technologies and some computational techniques that have been devised to address these challenges. In this discussion, we will first assume that reads are generated as contiguous substrings of a genome instead of read-pairs for the sake of simplicity.
Breaking reads into k-mers
First, given a k-mer substring of a genome, we define its coverage as the number of reads to which this k-mer belongs.
There is also a sense of coverage in terms of how well a collection of sequencing reads "cover" the genome. We have previously taken for granted that a sequencing machine can generate all k-mers present in the genome, but this assumption of "perfect coverage" does not hold in practice. For example, the popular Illumina sequencing technology generates reads that are approximately 300 nucleotides long, but this technology still misses many 300-mers present in the genome (even if the average coverage is very high), and nearly all the reads that it does generate have sequencing errors. How, then, can we use these reads effectively?
The left part of the figure below shows four 10-mer reads that capture some but not all of the 10-mers from an example genome. However, if we take the counterintuitive step of breaking these reads into shorter 5-mers (figure below, right), then these 5-mers exhibit perfect coverage. This read breaking approach, in which we break reads into shorter k-mers, is used by many modern assemblers.
Read breaking must deal with a practical trade-off. On the one hand, the smaller the value of k, the larger the chance that the k-mer coverage is perfect. On the other hand, smaller values of k result in a more tangled de Bruijn graph, making it difficult to infer the genome from this graph.
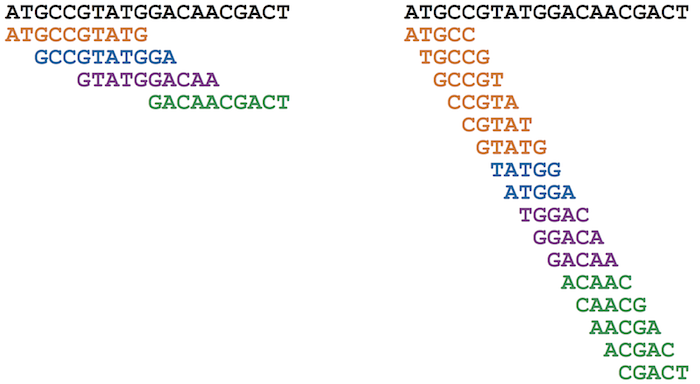
Figure: Breaking 10-mer reads (left) into 5-mers results in perfect coverage of a genome by 5-mers (right).
Splitting the genome into contigs
Even after read breaking, most assemblies still have gaps in k-mer coverage, causing the de Bruijn graph to have missing edges, and so the search for an Eulerian path fails. In this case, biologists often settle on assembling contigs (long, contiguous segments of the genome) rather than entire chromosomes. For example, a typical bacterial sequencing project may result in about a hundred contigs, ranging in length from a few thousand to a few hundred thousand nucleotides. For most genomes, the order of these contigs along the genome remains unknown. Needless to say, biologists would prefer to have the entire genomic sequence, but the cost of ordering the contigs into a final assembly and closing the gaps using more expensive experimental methods is often prohibitive.
Fortunately, we can derive contigs from the de Bruijn graph. A path in a graph is called non-branching if in(v) = out(v) = 1 for each intermediate node v of this path, i.e., for each node except possibly the starting and ending node of a path. A maximal non-branching path is a non-branching path that cannot be extended into a longer non-branching path. We are interested in these paths because the strings of nucleotides that they spell out must be present in any assembly with a given k-mer composition. For this reason, contigs correspond to strings spelled by maximal non-branching paths in the de Bruijn graph. For example, the de Bruijn graph below, constructed for the 3-mer composition of TAATGCCATGGGATGTT, has nine maximal non-branching paths that spell out the contigs TAAT, TGTT, TGCCAT, ATG, ATG, ATG, TGG, GGG, and GGAT. In practice, biologists have no choice but to break genomes into contigs, even in the case of perfect coverage (like in the figure below), since repeats prevent them from being able to infer a unique Eulerian path.
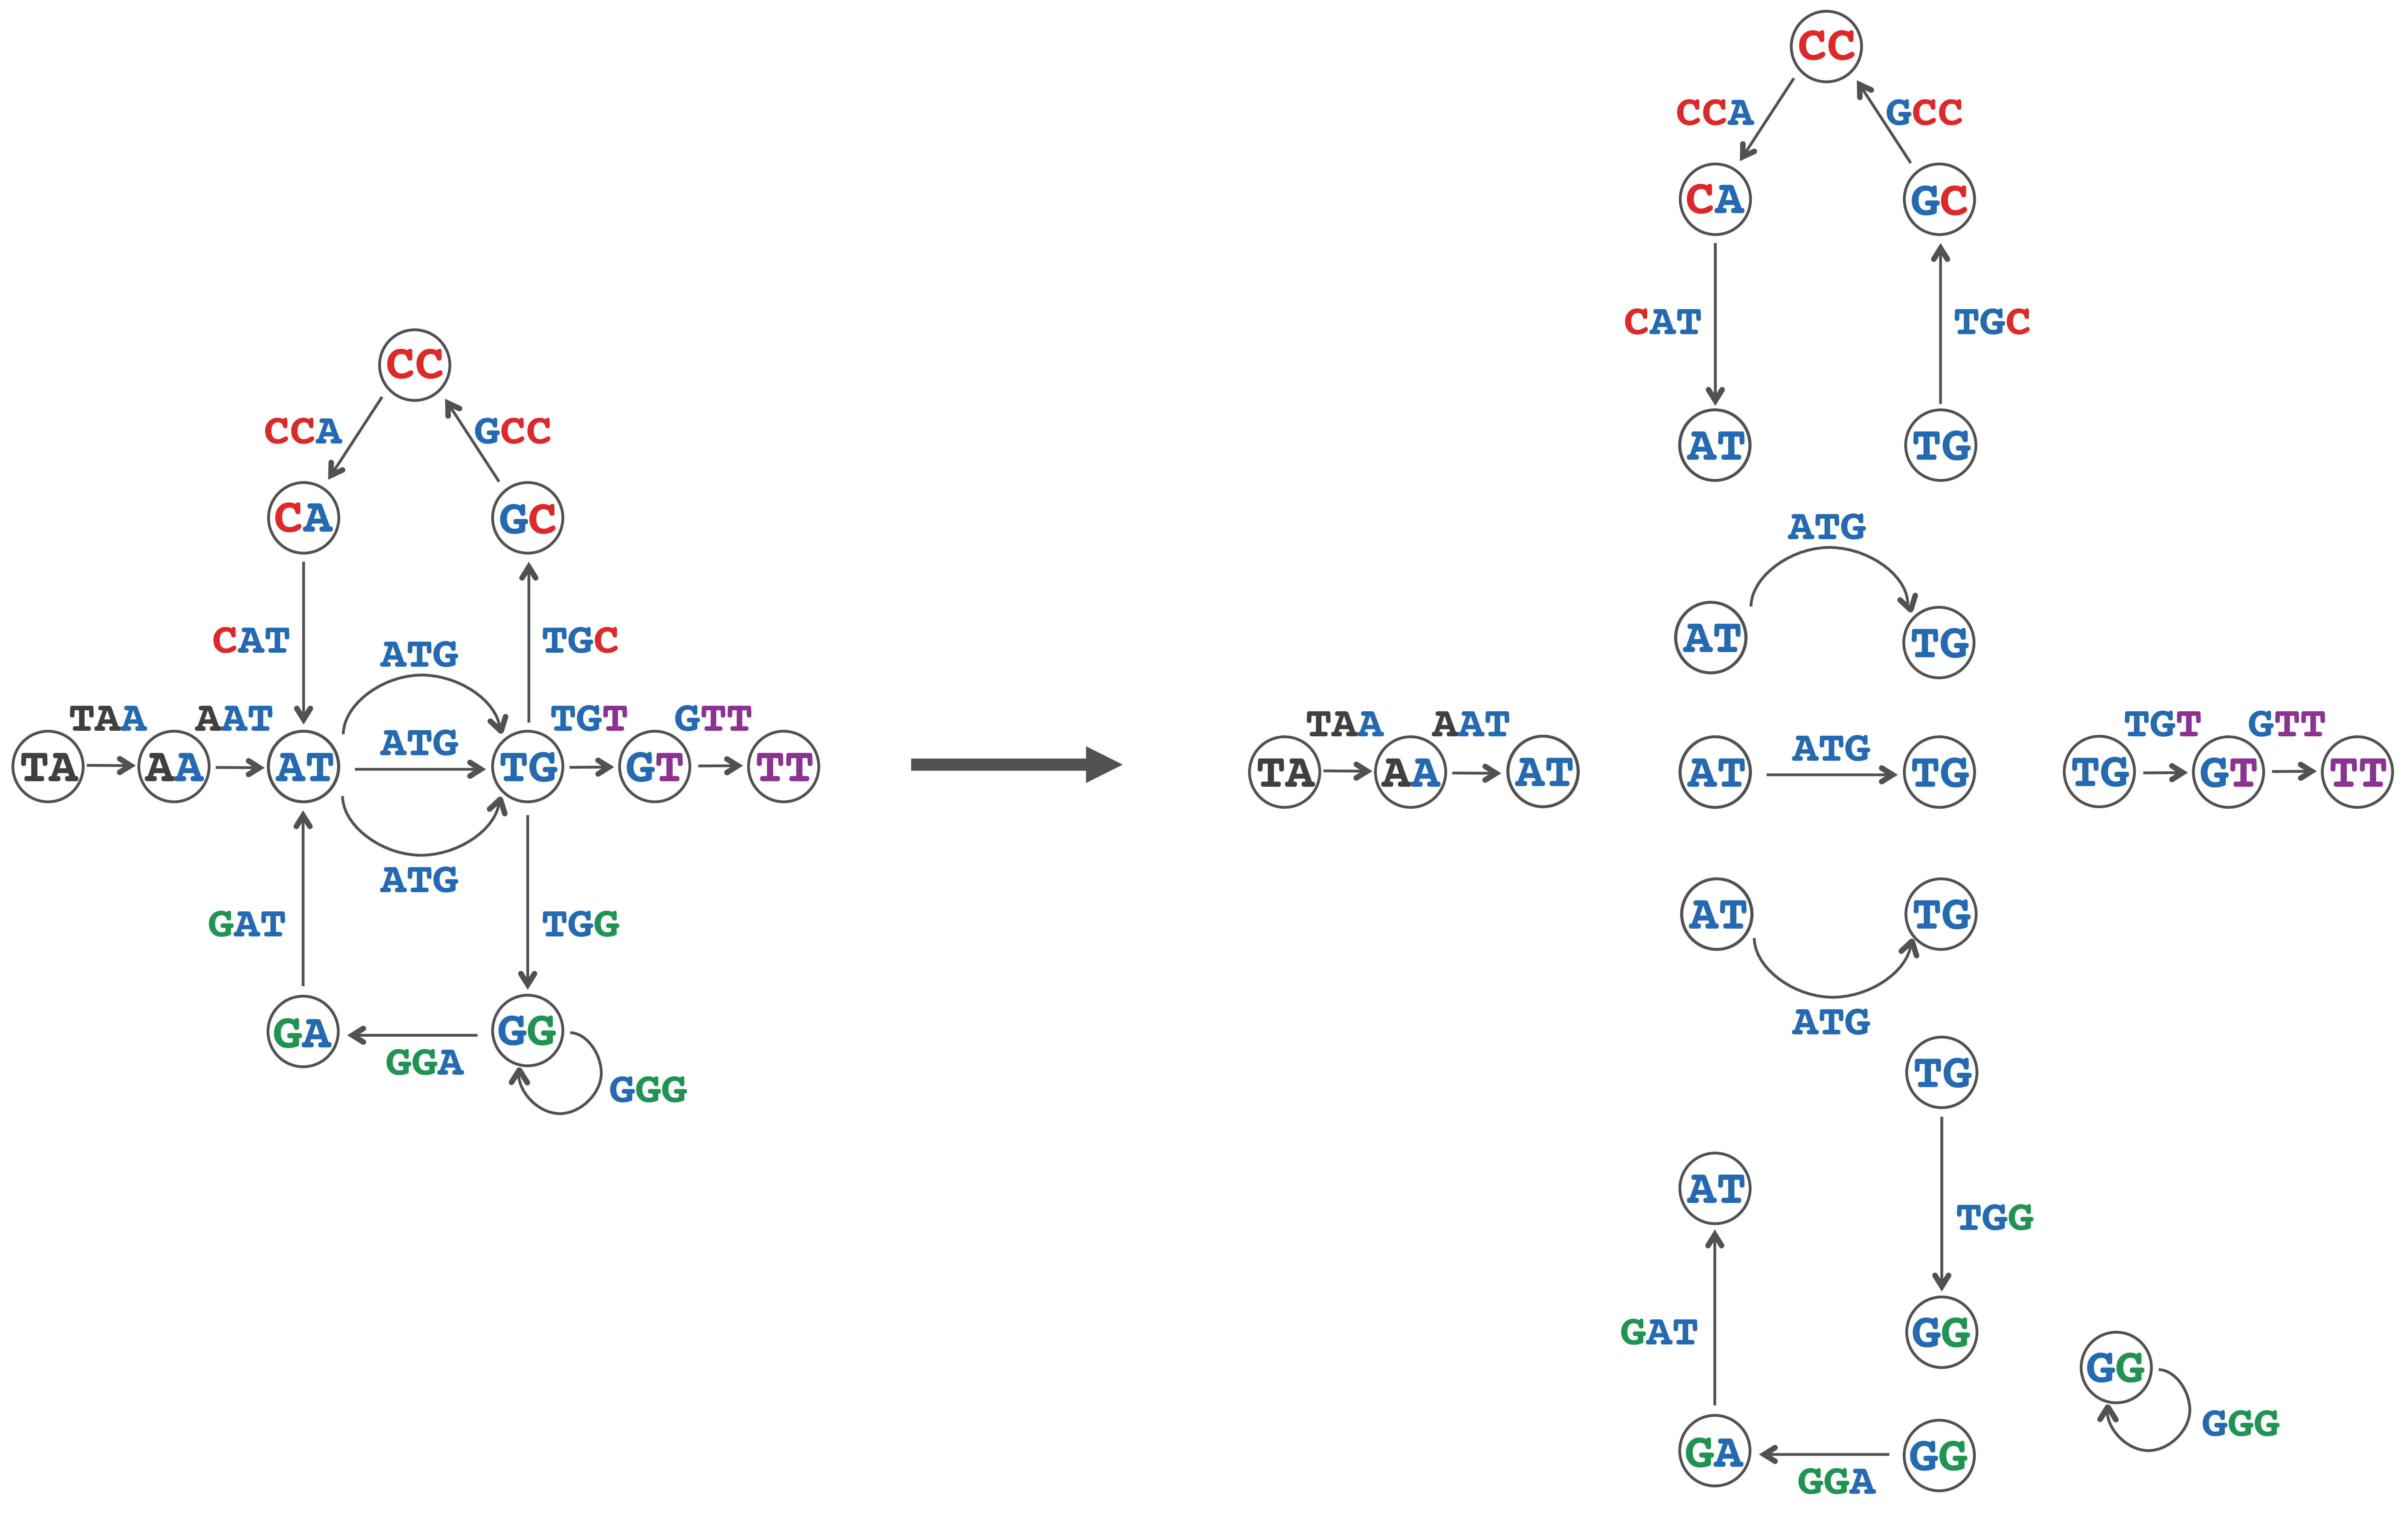
Figure: Breaking the de Bruijn graph into nine maximal non-branching paths representing contigs TAAT, TGTT, TGCCAT, ATG, ATG, ATG, TGG, GGG, and GGAT.
Contig Generation Problem: Generate the contigs from a collection of reads (with imperfect coverage).
- Input: A collection of k-mers Patterns.
- Output: All contigs in DeBruijn(Patterns).
Code Challenge Solve the Contig Generation Problem. (Solve at Cogniterra or Rosalind.)Solve it with the autograderFree to start in the interactive text
If you have difficulties finding maximal non-branching paths in a graph, check out "Charging Station: Maximal Non-Branching Paths in a Graph" in the print companion or at Cogniterra.
Assembling error-prone reads
Error-prone reads represent yet another barrier to real sequencing projects. Adding the single erroneous read CGTACGGACA (with a single error that misreads T as C) to the set of "broken" 5-mer reads from earlier in the lesson results in erroneous 5-mers CGTAC, GTACG, TACGG, ACGGA, and CGGAC after read breaking. These 5-mers result in an erroneous path from node CGTA to node GGAC in the de Bruijn graph below, meaning that if the correct read CGTATGGACA is generated as well, then we will have two paths connecting CGTA to GGAC in the de Bruijn graph. This structure is called a bubble, which we define as two short disjoint paths (e.g., shorter than some threshold length) connecting the same pair of nodes in the de Bruijn graph.
STOP and Think What is the size of the bubble (in the de Bruijn graph constructed from k-mers) introduced by a single error in a read?

Figure: A correct path CGTA → GTAT → TATG → ATGG → TGGA → GGAC along with an incorrect path CGTA → GTAC → TACG → ACGG → CGGA → GGAC form a “bubble" in a de Bruijn graph, making it difficult to identify which path is correct.
STOP and Think Design an algorithm for detecting bubbles in de Bruijn graphs. After a bubble is detected, you must decide which of two paths in the bubble to remove. How should you make this decision?
Existing assemblers remove bubbles from de Bruijn graphs. The practical challenge is that, since nearly all reads have errors, de Bruijn graphs have millions of bubbles (see below).
Bubble removal occasionally removes the correct path, thus introducing errors rather than fixing them. To make matters worse, in a genome having inexact repeats, where the repeated regions differ by a single nucleotide or some other small variation, reads from the two repeat copies will also generate bubbles in the de Bruijn graph because one of the copies may appear to be an erroneous version of the other. Applying bubble removal to these regions introduces assembly errors by making repeats appear more similar than they are. Thus, modern genome assemblers attempt to distinguish bubbles caused by sequencing errors (which should be removed) from bubbles caused by variations (which should be retained).
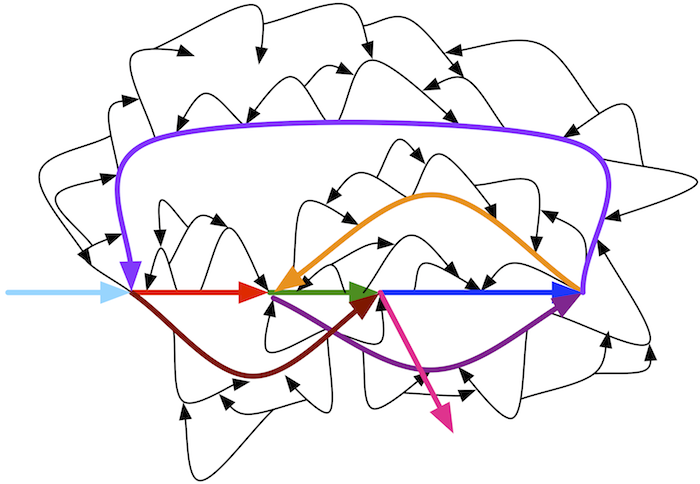
Figure: An illustration of a de Bruijn graph with many bubbles. Bubble removal should leave only the colored paths remaining.
Inferring multiplicities of edges in de Bruijn graphs
Next, while the de Bruijn graph framework requires that we know the multiplicity of each k-mer in the genome (i.e., the number of times the k-mer appears), this information is not readily available from reads. However, the multiplicity of a k-mer in a genome can often be estimated using its coverage. Indeed, k-mers that appear t times in a genome are expected to have approximately t times higher coverage than k-mers that appear just once. Needless to say, coverage varies across the genome, and this condition is often violated. As a result, existing assemblers often assemble repetitive regions in genomes without knowing the exact number of times each k-mer from this region occurs in the genome.
We have introduced you to some of the practical considerations in genome sequencing, but some still remain; for example, how do we deal with the fact that genomes are double-stranded? (See "DETOUR: Pitfalls of Assembling Double-Stranded DNA" in the print companion or at Cogniterra.) In practice, researchers will eventually obtain a collection of contigs from a genome sequencing experiments, but partitioning these contigs into two groups (corresponding to each strand) is a difficult problem that modern assemblers have yet to fully resolve. For example, if an assembler outputs five contigs, it may be that contigs 1 and 3 belong to one strand while contigs 2, 4, and 5 belong to the opposing strand.
However, we will give you a challenge problem that does not encounter these issues. Why? Developing assembly algorithms for large genomes is a formidable challenge because even the seemingly simple problem of constructing the de Bruijn graph from a collection of all k-mers present in millions of reads is nontrivial. To make your life easier, we will give you a small bacterial genome for your first assembly dataset.
Final Challenge Carsonella ruddii is a bacterium that lives symbiotically inside some insects. Its sheltered life has allowed it to reduce its genome to only about 160,000 base pairs. With only about 200 genes, it lacks some genes necessary for survival, but these genes are supplied by its insect host. In fact, Carsonella has such a small genome that biologists have conjectured that it is losing its “bacterial" identity and turning into an organelle, which is part of the host’s genome. This transition from bacterium to organelle has happened many times during evolutionary history; in fact, the mitochondrion responsible for energy production in human cells was once a free-roaming bacterium that we assimilated in the distant past.Solve it with the autograderFree to start in the interactive text
Given a collection of simulated error-free read-pairs (with exact distance d = 1000 between reads of length k = 120 within a read-pair), use the paired de Bruijn graph to reconstruct the Carsonella ruddii genome. Compare this assembly to the assembly obtained from the classic de Bruijn graph (i.e., when all we know is the reads themselves and do not know the distance between paired reads) in order to better appreciate the benefits of read-pairs. For each k, what is the minimum value of d needed to enable reconstruction of the entire Carsonella ruddii genome from its (k,d)-mer composition?
Exercise Break By the way, one more thing … what was the headline of the June 27, 2000 edition of the New York Times?
Bibliography Notes
After Euler’s work on the Königsberg Bridge Problem (Euler, 1758), graph theory was forgotten for over a hundred years but was revived in the second half of the 19th Century. Graph theory flourished in the 20th Century, when it became an important area of mathematics with many practical applications. The de Bruijn graph was introduced independently by Nicolaas de Bruijn (de Bruijn, 1946) and I. J. Good ( Good, 1946).
DNA sequencing methods were invented independently and simultaneously in 1977 by groups led by Frederick Sanger ( Sanger, Nicklen, and Coulson, 1977) and Walter Gilbert ( Maxam and Gilbert, 1977). A year previously, Walter Flyers and colleagues had sequenced a shorter virus called MS2, but Sanger’s approach scaled for larger genomes. DNA arrays were proposed simultaneously and independently in 1988 by Radoje Drmanac ( Drmanac et al., 1989), Andrey Mirzabekov ( Lysov et al., 1988 ) and Edwin Southern ( Southern, 1988). The Eulerian approach to DNA arrays was described in 1989 ( Pevzner, 1989).
The Eulerian approach to DNA sequencing was described by Idury and Waterman, 1995 and further developed by Pevzner, Tang, and Waterman, 2001. To address the challenge of assembly from short reads produced by next generation sequencing technologies, a number of assembly tools that are based on de Bruijn graphs have been developed (Zerbino and Birney, 2008, Butler et al., 2008). Paired de Bruijn graphs were introduced by Medvedev et al., 2011.
The Sleeping Beauty transposon system was developed by Ivics et al., 1997.